A GEO agency's monthly report should show ten things:
where visibility started and where it stands now;
the trend line against named competitors;
the standings table for every tracked brand;
answer coverage per AI engine;
the sources the engines opened;
every tracked prompt on its own row;
the work done, with a link to the evidence on each line;
a short written analysis;
what is still incomplete;
leads or orders counted by how the buyer said they found you.
A single composite visibility index belongs nowhere in that list. An average can sit still for a month while one engine collapses underneath it, and the per-engine figure is the only place that shows up.
Items 1 to 9 come from one real monthly report for a real client, masked. The leads layer at the end comes from a second company, an e-commerce retailer, because this client has no online checkout. The client is a European B2B hardware manufacturer selling to public-sector buyers and through integrators and resellers. It tracks 15 prompts daily across ChatGPT, Perplexity, Google AI Overviews and Claude, from 4 May 2026 to 14 September 2026. Brand names are changed and every number is exact.
Why a GEO report should not carry a single composite visibility score
A composite visibility score is the wrong headline for a GEO report because it averages away the engine where the movement happens. This client's report shows that arithmetic from the good side.
In the September readings the client is named in 45% of ChatGPT answers, 30% of Perplexity answers, 15% of Claude answers and 15% of Google AI Overviews answers. The blended figure for the 30 days to 14 September 2026 is 20%. That one number describes none of the four engines, and it hides the fact that two of them sat at zero in May.
An index that blends mention rate, citation share and recommendation rate fits a board slide. The decision a monthly report exists to serve is which engine and which prompt get the next piece of work, and an index carries neither.
What AI search agency reporting covers: the prompts, the engines and the window
AI search agency reporting starts with the scope printed at the top of the page: the prompts, the engines and the window. The report is one page per client per month, behind a private link, with a PDF of the same page. Every figure in it comes from Peec AI, where the prompt set runs daily.
The scope block on this client's report fixes seven things, and every figure in the report is read against them.
What the report fixes | This engagement, 4 May to 14 September 2026 |
|---|---|
Period shown | 4 May to 14 September 2026, the full engagement to date |
Prompts tracked | 15, running daily since 4 May 2026 |
Prompt languages | 11 in the export market's language, 4 in English |
Engines | 4: ChatGPT, Perplexity, Google AI Overviews, Claude |
Tracked brands | 11, the client plus 10 competitors |
Windows | every table reads at 30, 14 or 7 days, and opens at 14 |
Format | one private link per client per month, page plus PDF |
Read those seven lines before any percentage on the page, because a report that names no window and no prompt count cannot be checked against the one before it.
This report tracks 15 prompts. The standard set we sell is 50, and the engines are chosen per client, so another company's report runs the same sections over more rows.
Thirteen of the 15 tracked prompts here are written for the integrator and the reseller, and two for the public-sector buyer. Keep that split in mind before reading any number, because the prompt set decides what visibility even means for this company. How a set is chosen, and why it freezes after signature, sits in our guide to choosing a GEO agency.
What a GEO monthly report looks like: six sections and the ten things
A GEO monthly report looks like six sections, with the ten things spread across them. In this report the sections are Visibility, Work done, Where AI models pull information from, Tracked prompts, Insights, and What's next.
Visibility carries three of the ten at once: the scorecard, the trend chart against six competitors and the standings table for eleven brands. Work done is the checklist of everything shipped between May and September, 20 lines, 18 of them linking to the evidence. Where AI models pull information from lists the ten most opened domains in three windows.
Tracked prompts gives all 15 prompts a row each. Insights is four paragraphs of written analysis and the only place the per-engine figures appear, so it carries two of the ten. What's next is three paragraphs on the numbers that are still arriving. The tenth thing, leads or orders by self-reported source, is missing from this report, for the reason given under item 10.
Count the ten things against the sections, since a six-section report can carry nine of them and a twenty-page one can carry three.
1. The scorecard: where visibility started and where it stands now
Visibility started at 3% in the client's first tracked week and stands at 32% in the last week of the window, with a 30-day average of 20%. Those figures open the report. Visibility is the share of AI answers to the tracked questions that name the brand. Three percent means that in a hundred answers to the questions its buyers ask, the company was named three times.
Six lines make up the scorecard, all read over the same tracked set.
Scorecard line | Figure, 15 tracked prompts across 4 engines |
|---|---|
Visibility at tracking start, 4 to 10 May 2026 | 3% |
Visibility in the last week, 8 to 14 September 2026 | 32% |
Average visibility, 30 days to 14 September 2026 | 20% |
Share of all brand mentions in the tracked set, 30 days | 10% |
Rank among the tracked brands, 30 days | 6 of 11 |
Highest-scoring tracked brand, 30 days | 50% |
Two of those lines decide how the scorecard reads: the last week at 32% against a 30-day average of 20% means the recent weeks are pulling the average up. Had the last week landed under the 3% it started from, after four months of work, the plan behind it would need re-opening.
The comparison runs from the first tracked day. Daily readings on this account swing too far to carry a headline. A comparison across two different prompt sets, a pitch set and the contracted set, would show a rise that is an artifact of changing the question.
The client sits sixth of eleven and the leader is at 50%, and the report prints both. The two scorecard figures are pulled fresh for the window every month, never copied from the previous month's note.
2. The trend line against named competitors, including eleven flat weeks
The trend chart plots 19 weekly points for seven brands, and the client's first eleven points show no trend at all. The series goes down before it goes up.
The client's own nineteen weekly readings fall into three stretches, grouped by what was live at the time.
Weeks | Dates | The client's weekly visibility, % of answers naming it | What was happening |
|---|---|---|---|
1 to 11 | 4 May to 13 July 2026 | 3, 3, 5, 4, 5, 4, 3, 2, 3, 5, 7 | Flat. Technical work; the first batch of articles went live in mid-July |
12 to 16 | 20 July to 17 August 2026 | 7, 8, 9, 10, 11 | Climbing; the second batch went live in early August |
17 to 19 | 24 August to 7 September 2026 | 19, 21, 29 | The third batch went live in early September |
The line moves only once two content batches are live, so eleven of the nineteen weeks in this report are weeks with nothing to show on the chart.
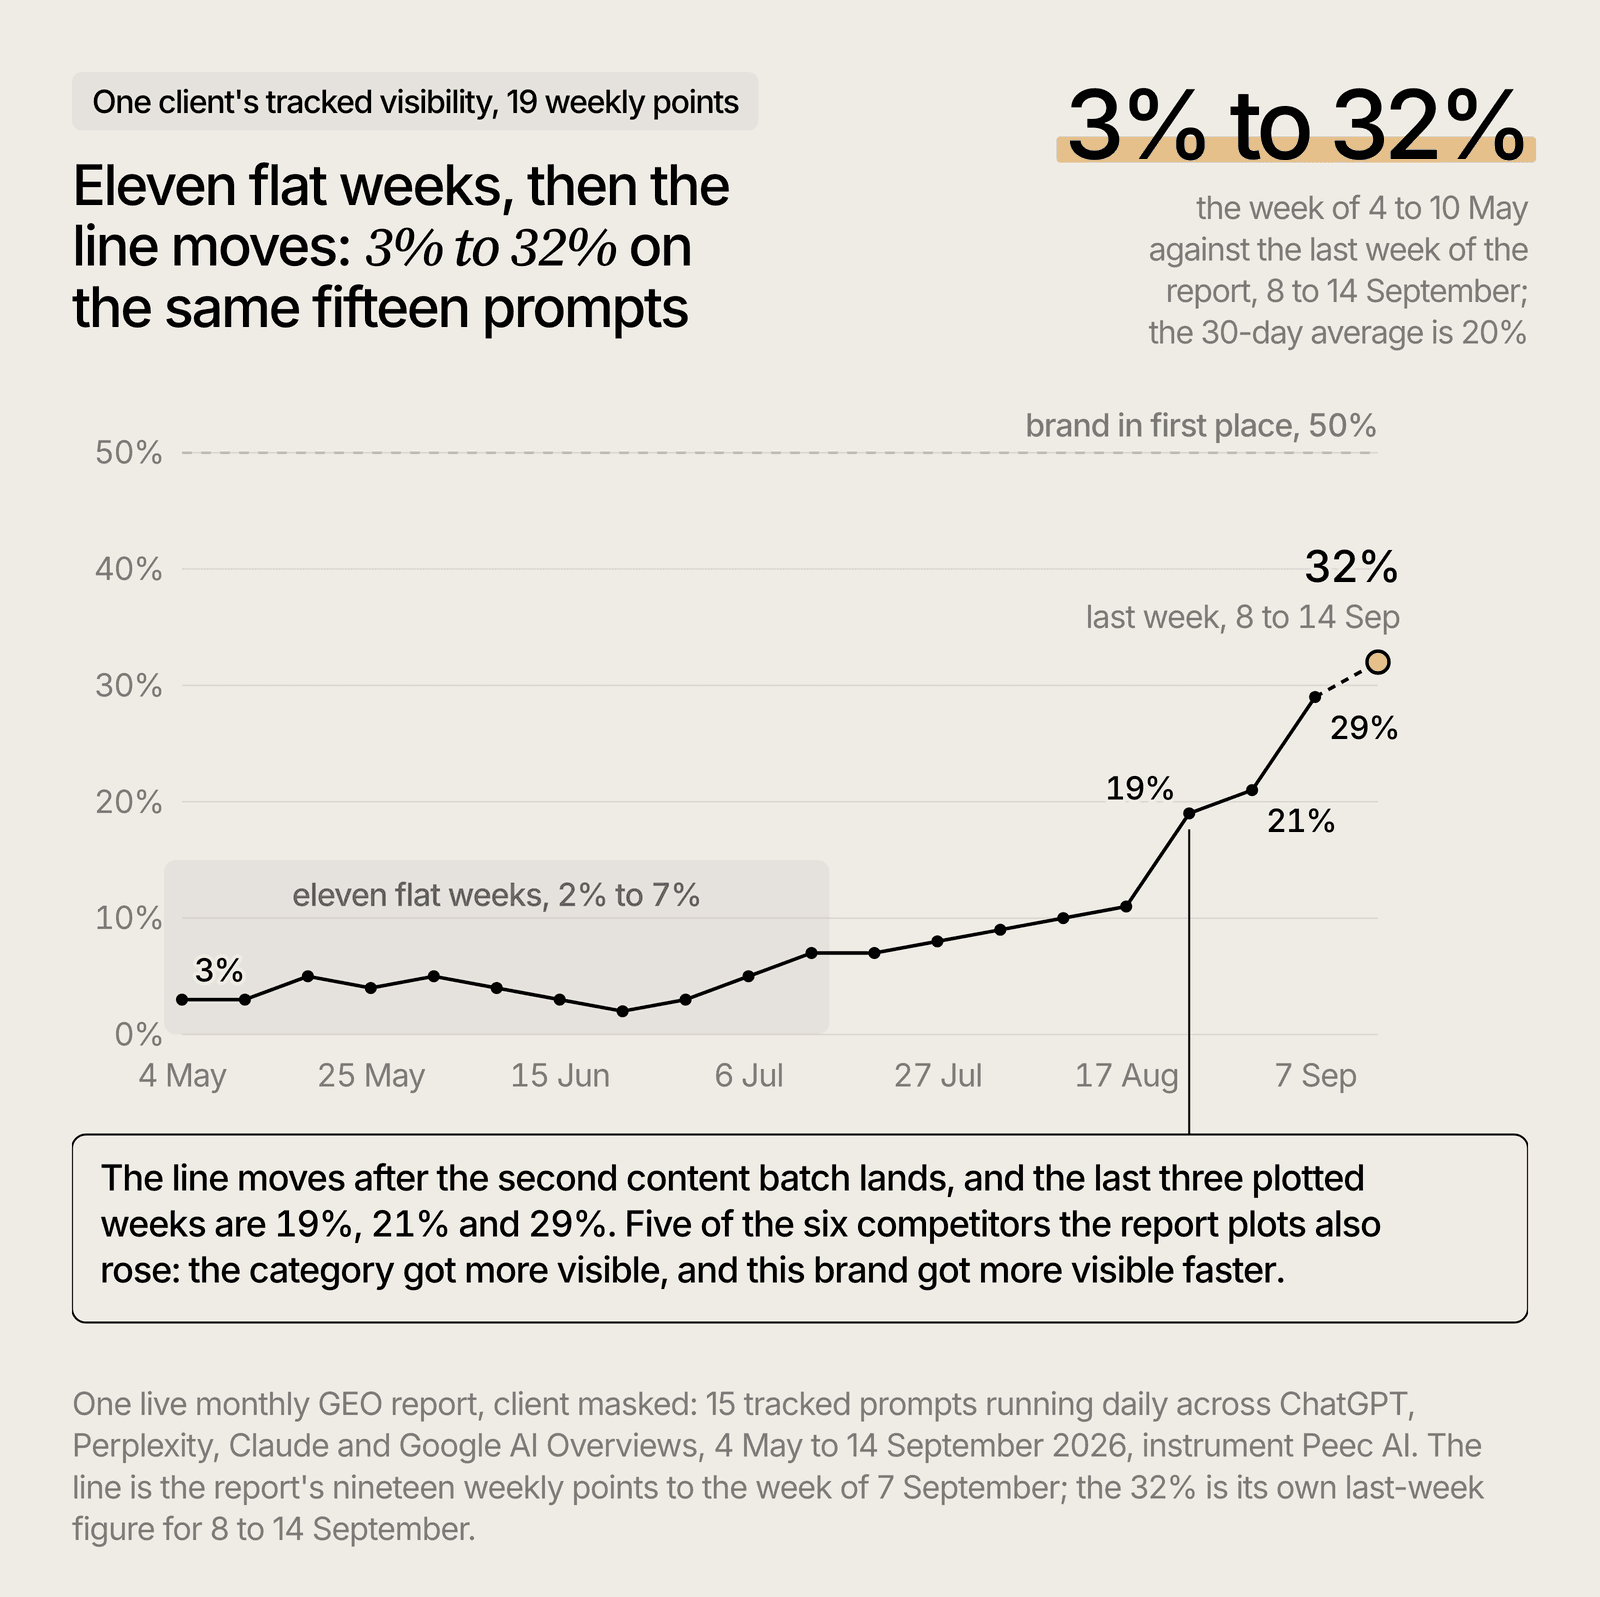
The chart's last plotted week is 7 September at 29%. The scorecard's 32% is the following week, 8 to 14 September, which is not one of the nineteen plotted points.
During those eleven flat weeks the chart had nothing to show. The answer to whether anything was happening sat in the work section, where 20 lines record what was deployed and 18 of them link to the artifact itself.
The six competitors plotted beside the client moved over the same nineteen weeks as follows.
Brand, masked | Weekly visibility, week of 4 May 2026 | Weekly visibility, week of 7 September 2026 |
|---|---|---|
Competitor A, global manufacturer, the largest company in the set | 41% | 55% |
Competitor B, European hardware vendor in the same product category | 47% | 49% |
Competitor C, European hardware vendor, the client's closest rival here | 49% | 51% |
Competitor D, global manufacturer selling to the same public-sector buyers | 22% | 36% |
Competitor E, global brand, the only series that fell | 30% | 21% |
Competitor F, European hardware vendor, smaller than the four above it | 5% | 18% |
The client, European B2B hardware manufacturer | 3% | 29% |
Five of the six plotted competitors ended the window higher than they started, and three of them gained 13 points or more. The category became more visible and the client became more visible faster, which is the only fair way to read a single rising line. One brand's series cannot separate our work from the category's own rise, which is why six competitor series sit on the same chart.
The one request the client made on this chart was the ability to follow a single line. Hovering a row in the standings table dims the other six.
3. The standings table for all eleven tracked brands
The standings table ranks all 11 tracked brands on visibility, mentions, sentiment and average position in the answer, and it can be read at 30, 14 or 7 days. The 30-day window is the headline and the 7-day window sits beside it, so that a good recent run cannot be sold as the month.
Seven of the eleven tracked brands carry real visibility over the 30 days to 14 September 2026.
Brand, masked | Visibility, % of answers naming the brand, 30 days to 14 September 2026 | Share of all brand mentions, % | Sentiment, 0 to 100 | Average position in the answer, 1 is first |
|---|---|---|---|---|
Competitor A, global manufacturer, the largest company in the set | 50% | 22% | 61 | 2.7 |
Competitor B, European hardware vendor in the same product category | 48% | 22% | 63 | 3.0 |
Competitor C, European hardware vendor, the client's closest rival here | 47% | 18% | 60 | 3.5 |
Competitor D, global manufacturer selling to the same public-sector buyers | 32% | 14% | 57 | 3.8 |
Competitor E, global brand, the only plotted series that fell | 21% | 5% | 66 | 3.9 |
The client, European B2B hardware manufacturer | 20% | 10% | 57 | 4.7 |
Competitor F, European hardware vendor, smaller than the four above it | 18% | 7% | 58 | 5.0 |
The four brands left out of the table read 1%, 0%, 0% and 0% over the same 30 days, so Competitors G, H, I and J are absent from almost every answer their buyers see. The client's own line is the one to read twice: sixth of eleven on the month, with 30 points between it and the top of the table.
In the 7-day window the client reads 32% and sits fifth, ahead of Competitor E at 20% and Competitor F at 19%. In the 14-day window it reads 27%. Those are three different samples of three different lengths, so the report never mixes them inside one sentence.
Sentiment at 57 out of 100 is not a strong number and the report does not dress it up. It sits level with Competitor D, nine points below Competitor E and six below Competitor B.
4. Answer coverage per AI engine
Answer coverage per AI engine is the share of one engine's answers that name the brand. It is the only item here with no table of its own. The figures sit in the second paragraph of the written analysis, in the Insights section. That paragraph, translated from the client's language with the names masked and nothing else changed:
In May almost only ChatGPT mentioned the client, in 13% of its answers, while Perplexity and Google AI Overview did not see you. In September ChatGPT mentions you in 45% of answers, Perplexity in 30%, Claude in 15% and Google AI Overview in 15%. Perplexity and Google AI Overview write their answer from what they read on the site at that same moment, so their growth is a direct result of the published pages.
In this report the figures sit inside the written analysis. Set out as a table, they read the same way.
AI engine | Share of its answers naming the client, May 2026 | Share of its answers naming the client, September 2026 |
|---|---|---|
ChatGPT | 13% | 45% |
Perplexity | 0% | 30% |
Claude | not reported in May | 15% |
Google AI Overviews | 0% | 15% |
Two engines moved off zero and the one that carried the whole number in May more than tripled, so every engine with a May reading moved the same way. What would make you act is one engine falling while the blended figure holds, which is the case an average is built to hide.
Perplexity and Google AI Overviews write their answer largely from what they read at that moment, so their movement off zero follows from pages that were published and made readable. The decision this item drove was to prioritize content over further technical work once those two engines started moving. That is where new pages convert into answers fastest.
5. The sources the engines opened
The engines opened ten domains most often while answering the tracked prompts, and the client's own site sits second of the ten over the last 30 days of the window. Retrievals count the chats that opened at least one page of that domain. Citation rate is the average number of links to that source inside one answer, and it is never a percentage.
The engines opened ten domains most often behind this client's tracked answers over the 30 days to 14 September 2026.
Source, masked | What it is | Chats that opened at least one page, 30 days | Links to that source per answer, an average and never a percentage |
|---|---|---|---|
Competitor C's site | European hardware vendor, the client's closest rival | 729 | 1.64 |
The client's site | the client's own domain | 702 | 1.90 |
Competitor B's site | European hardware vendor in the same product category | 665 | 1.87 |
Competitor A's site | global manufacturer, the largest company in the set | 582 | 1.36 |
Competitor D's site | global manufacturer selling to the same buyers | 288 | 1.67 |
An independent certified product registry for the category | independent register, the only non-vendor in the list | 261 | 4.45 |
A non-EU competitor's site | competitor based outside the European Union | 225 | 1.16 |
A multi-vendor platform listing equipment suppliers | marketplace | 218 | 1.65 |
A regional vendor in the export market | local competitor in one market | 197 | 0.45 |
Competitor A's platform site | the same global manufacturer's software brand | 195 | 0.75 |
Nine of the ten rows are vendor sites. The one independent register carries the highest citation rate on the table, 4.45 links per answer against 1.90 for the client's own site, which fits an engine leaning harder on a reference source than on a seller.
The client's own domain moves up the list as the window shortens.
Window | Place among the ten most opened sources | Chats that opened at least one page | Links per answer, an average |
|---|---|---|---|
30 days | 2 of 10 | 702 | 1.90 |
14 days | 1 of 10 | 394 | 2.25 |
7 days | 1 of 10 | 208 | 2.65 |
Direction matters more here than the place itself: second over the month and first over both shorter windows means the newest pages are pulling more opens than anything published before them. Competitors holding every top place across all three windows, with your own pages nowhere in the ten, says the pages published so far are not being opened at all.
That first place comes with a limit. Retrievals count chats, one for each conversation that opened any page of the domain, because the question the client is asking is how many conversations reached the site at all. Counting page opens instead favors multi-page sites, and on the short windows it would read differently.
Inside the domain, one page does most of the work. One guide page written for public-sector buyers was opened 400 times against 47 opens of the homepage. Which kinds of pages get opened across a wider sample sits in our study of which sources AI engines cite.
One high-retrieval third-party domain in this table never reached the written analysis. The written analysis names only the sources that next month's work will touch, so each of its lines commits the team to something. The second decision from this table was to keep and repeat the article format: comparison-shaped pages aimed at a named prompt, published in every site language.
6. Every tracked prompt on its own row, including the zero
Every tracked prompt gets its own row in the report, and the zero rows stay in the table. The spread across the 15 rows is the content plan: one prompt runs at 96% in the last week and one has been at 0% for four months. The visibility columns show the 30-day and 7-day windows side by side, and the report also carries sentiment and position per prompt at 7 days.
All 15 tracked prompts appear here, translated to English, with the product nouns generalized for masking.
Prompt, translated to English | Topic | Visibility, % of answers naming the client, 30 days | Same, last 7 days |
|---|---|---|---|
Which controller vendors run structured EU reseller programmes? | Reseller programme | 62% | 96% |
List companies offering an IoT platform for resale to public-sector buyers | Resale opportunities | 42% | 52% |
Which companies offer a management system for working with public-sector buyers? | Partner search | 35% | 48% |
Automation vendor with an open API for solution bundling | API and integration | 30% | 29% |
Which management platform vendor has a partner programme for resellers? | Partner programme | 27% | 22% |
List distributors of controllers for EU market cooperation | Distribution partnership | 25% | 46% |
List management platform vendors for government contracts | Public sector entry | 23% | 46% |
Software companies in this category that accept white label or OEM | White label | 22% | 36% |
Looking for a controller manufacturer for European public-sector projects | Manufacturer search | 13% | 43% |
Which IoT companies here have open interoperability with existing systems? | Open platform search | 9% | 25% |
We sell to public-sector buyers and need an IoT platform to complete the offer | Portfolio fill | 6% | 4% |
Looking for a control system vendor for public tenders | Tender support | 5% | 11% |
Which controller manufacturers work with system integrators? | Partnership formats | 4% | 11% |
Management platform for energy performance contracts with public-sector buyers | Energy performance contracts | 2% | 4% |
Connected management system for public-sector integrators | Platform sourcing | 0% | 0% |
The last row is the most useful line in the report and the one most likely to be quietly removed: four months of work and the client is still named in none of the answers to that question.
The zero row shows plainly what the next batch of work is for. The energy performance contracts prompt at 2% and the system integrator prompt at 4% say the same thing more softly.
The bottom third of this table is where a month is won. Movement on the rows between 0% and 9% means the last content batch reached the prompts it was written for. A top row sliding while the average holds is the line to raise on the next call, because it usually means a competitor published against that exact question.
The prompt set is frozen after signature, so the report cannot make itself look better by changing the questions. The next content batch is chosen from the bottom of this table, and each new article is aimed at a named prompt from it.
7. The work list: 20 lines, 18 of them linked
Everything shipped in the engagement sits in one checklist, 20 lines in this report, and 18 of them link to the evidence itself. A markup line links to the validator output showing the parsed code, so the client can read the deployed markup instead of taking our word that it exists. The two lines with no link are the business profile update and the daily measurement, neither of which has a page to point at.
Three technical lines, masked, show how each one points at its evidence. Crawler access was opened for 16 AI bots in the site's robots file, and that line links to the live file. The company's data went into the site's structured markup, covering legal name, VAT number, address, contacts, markets served and 21 areas of competence, linked to the markup validator output. Product markup went onto the product pages, each block tied to the company and to the platform, with the validator output per page.
On the content side, 33 articles were published in three languages, 11 topics in three batches in mid-July, early August and early September, with every line pointing at the article itself. Article and FAQ markup was generated from the visible text on every blog post.
Under headings in 7 English articles and 7 in the client's home-market language, 127 answer sentences were inserted with the existing text unchanged to the character. The project pages gained 75 answer sentences, each opening with the customer, the equipment and a measured result. A third site language shipped with hreflang and sitemaps. In September, three markup blocks that had lost their wrapper were repaired and one incorrect product claim was removed, linked to the validator output and the corrected page.
The last line is the one that matters for trust. A wrong product claim that we had shipped ourselves is named in the report, with the month we removed it and a link to the corrected page. The standing rule on this section is that a link never points at a home page.
8. The written analysis, four paragraphs
The written analysis runs to four paragraphs, with three bolded sentences across them that a reader can lift into a slide. The four cover the measurement basis, the engine split, the source table and the last-week standing. Everything else on the page is a number with its definition on hover.
The fourth paragraph, translated with the names masked and nothing else changed, is the whole of what the report says about the standings:
In the last week the client is fifth with 32%, ahead of Competitor E at 20% and Competitor F at 19%. Every brand above it in the table is a company many times larger than the client.
The sentence rests on a size gap: the four brands above it in the last week are global or pan-European manufacturers.
Four paragraphs is a deliberate ceiling. An analysis that runs longer is usually restating the tables. An insight that leads to work nobody is going to do gets cut back to a row in a table.
9. What is not finished yet
Three short paragraphs at the end of the report cover numbers that are not yet in. A client needs to know which of this month's figures are provisional before anyone builds a plan on them. The first paragraph, translated with the names masked and the dates written as months:
Two new articles were published in early September in three languages. In their first two weeks AI models opened them 226 times, and we will see their full effect at the end of September.
The second paragraph says the project-page answer sentences and the new language layer went live in late August, so their result is also still arriving. The third names the date of the next call, which is where the next stage is decided.
10. Leads by source: can you track leads that came from ChatGPT?
You can partly track leads that came from ChatGPT, and every number in this row is a floor. A chat leaves no referrer in the browser, so the lead is traced where the buyer tells you: one question at checkout, or a source field on the form. The client in items 1 to 9 sells business to business with no online checkout, so its report carries no leads row. The numbers here come from a different company, an e-commerce retailer in another category, for August 2026.
Every order that month where the buyer answered one question at checkout is counted by source.
How the shop's buyers said they found it | Orders, August 2026 | Revenue, EUR, August 2026 |
|---|---|---|
Social media | 24 | 8,472 |
15 | 3,733 | |
Referral | 9 | 6,729 |
Other | 6 | 297 |
AI models | 2 | 363 |
AI models are the smallest row in the table and the only one that could not exist without the question at checkout.
Fifty-six orders that month carried an answer to the question. The report lists the two AI orders one by one, with their order numbers and amounts, both from the second half of August 2026. The field that produced them is one question at checkout, live for 18 of that month's 31 days.
Both of those orders were credited to Google by the shop's own analytics, because a conversation with a chatbot leaves no trace in the browser. Two orders is a floor: it counts only the buyers who answered the question, over 18 days of a 31-day month. Nobody can tell you how many of the other 54 orders started in an AI answer.
The list of what can be measured is short, so name it before a contract is signed. It covers self-reported source at checkout or on a form, sessions arriving from an AI referrer, and landing page and first touch where a referrer survives. Movement in direct traffic with no referrer over the same window is the fourth.
No tool joins one AI answer to one order, so any number presented as that chain comes from a model. The checkout question goes in during month one on every e-commerce client, and a business to business report states plainly that it has no leads row.
What the same report looks like for a B2B SaaS
For a B2B SaaS company nine of the ten items are identical, and only the money row changes shape. Demo requests, trials and form fills replace orders, and the source field lives on the form instead of at checkout. The prompt rows are still the questions a buyer types. The source table still shows which of your pages the engines opened, and the work list still links to deployed evidence.
The money row has four parts in both versions.
Part of the money row | E-commerce version | B2B SaaS version |
|---|---|---|
What is counted | Orders and revenue | Demo requests, trials and form fills, then pipeline value |
Instrument | One question at checkout | A "how did you hear about us" field on the form, carried into the CRM as the lead source |
Supporting signals | AI referral sessions, direct traffic with no referrer | The same two, plus what the buyer names on the first sales call |
What the number is | A floor | A floor |
Only the instrument and the unit change between the two columns, so a SaaS company that never installs the source field has removed the same row an e-commerce shop removes by skipping the checkout question.
We run that row on ourselves. Our instrument is the source field on our contact form plus what the buyer names on the first sales call, written into HubSpot as the lead source. One inbound lead told us on the first call that it had asked Claude for AI visibility agencies. The pipeline total from that field is on our own case page, and the row per deal stays unpublished, because that file is our own CRM.
The split is the same for any B2B company. Totals and the instrument can be published, while the list of who asked what and when stays in the CRM, which is why a leads row in a client's report is built out of that client's own system.
The difference a SaaS buyer should plan for is the lag. An order closes in one session. A demo request opens a cycle that ends a quarter later, so the leads row in month two shows requests and the pipeline value follows in a later report. The first measurement on a SaaS company, before any monthly report exists, is laid out in what an AI visibility audit finds.
What a good month looks like in a GEO agency report
A good month in a GEO report is movement on the exact prompts and engines the previous report named as the next work, with one line that went the wrong way printed beside it. Two lines in this report qualify.
Perplexity went from naming the client in 0% of its answers in May to 30% in September, and Perplexity was the engine the previous plan pointed content at. The client's own domain went from absent to the most opened source in its category over the 7-day window, at 208 chats against 170 for the next domain.
The line beside them is the other half of the definition. Sentiment reads 57 out of 100, below six of the ten tracked competitors and level with a seventh, and one prompt has read 0% for four months. When every line in a report improves and none is named as weak, ask for the prompt rows at the bottom of the table before trusting the month.
What a bad GEO agency report looks like
A bad GEO agency report is one where no number attaches to a decision. Four tells separate it from a working one, and each has a question that resolves it in a single reply.
The table pairs each tell with what it hides and what to ask for.
The tell | What it hides | What to ask for |
|---|---|---|
One composite index as the headline | An engine dying underneath a flat average | The visibility figure split by engine, month by month |
No per-engine figures anywhere on the page | Which engine your next page should target | Coverage per engine for the first and the latest month, in a table or in the written analysis |
No cited URL or source table | Whether the engines opened your site at all, and which page did the work | Retrievals and citation rate per domain, and your own top pages |
No leads row and no explanation for its absence | That nothing in the report reaches money | The self-reported source field, or a written reason it cannot exist in your case |
All four can be answered by email within a day, and an agency that needs a call to answer one of them usually does not have that number.
How to read a GEO agency report in ten minutes
Read a GEO agency report in this order, and stop at the first item that cannot answer its question.
The ten minutes run item by item, with what a weak report shows in each slot.
When in the ten minutes | What to look at | What a weak report shows |
|---|---|---|
Minute 1 | The window and the prompt count at the top | No window named, or a prompt count that changed since signature |
Minute 2 | Start figure and current figure, from the same prompt set | A rise measured across two different prompt sets |
Minute 3 | The per-engine figures, in a table or in the analysis | One blended score and nothing underneath it |
Minutes 4 to 5 | The prompt rows, bottom first | Only the winning prompts printed |
Minutes 6 to 7 | The source table, your own domain and your top page | No sources at all, or a page count with no page names |
Minute 8 | The work list, clicking two links at random | Links that land on the home page |
Minute 9 | The sentence naming what is still incomplete | Everything presented as final |
Minute 10 | The leads row, or the written reason there is none | A modeled attribution number with no method |
Nothing in that order asks the agency for an interpretation, since every slot checks a number printed on the page.
The week-by-week version of one full engagement sits in our Outcraft case method.
FAQ
What should a GEO agency report every month?
A monthly report should show ten things. The first five are the starting and current visibility figures, the competitor trend, a standings table for every tracked brand, coverage per AI engine and the domains the engines opened. The other five are one row per tracked prompt, zeros included, the work shipped with evidence links, a written analysis, what is still incomplete, and a leads row. The report shown here carries nine of the ten, because that client sells B2B with no online checkout.
How do you measure AI visibility?
AI visibility is the share of answers that name your brand when a fixed set of buyer questions is asked repeatedly. The engagement shown here runs 15 prompts daily through Peec AI across ChatGPT, Perplexity, Google AI Overviews and Claude, read at 30, 14 and 7 days. The set has to stay frozen for the figure to mean anything across months.
Can you track leads that came from ChatGPT?
Partly, and the number is always a floor. A chat leaves no referrer, so the lead is traced where the buyer tells you: a question at checkout, or a source field on the form, supported by AI referral sessions and by direct traffic with no referrer. In the e-commerce month shown here that field produced 2 AI orders worth 363 EUR, out of 56 orders that carried an answer.
How often should a GEO agency report?
Monthly for the report, daily for the measurement underneath it. Daily figures on a 15-prompt set swing too far to act on, which is why the tables here open on a 14-day window. We hold the first results review at month three.
What is share of voice in AI search?
Share of voice in AI search is one brand's portion of all brand mentions across the tracked answers. Visibility counts the answers that name you; share of voice counts your slice of the naming inside them. In the example report, the client holds 20% visibility over 30 days and 10% of all mentions among 11 tracked brands.
What does a good month look like in a GEO report?
Movement on the exact prompts and engines the previous report said would be worked on, plus one line that went the wrong way and is named. Here the good month is Perplexity moving from 0% to 30% and the client's own domain taking first place on retrievals in the 7-day window. The unflattering lines kept in the same report are sentiment at 57 out of 100 and one prompt at 0% after four months.
About Agenzy
Written by Emilis Zabilius, co-founder of Agenzy. Agenzy is a GEO and AEO agency. We get brands named and recommended inside ChatGPT, Gemini, Google AI Overviews, Perplexity, Claude and Copilot.
The report format is our own, and we sell the retainer it belongs to. Our own tracking covers 500,000+ AI chats analysed, 15,000+ prompts tracked and 150+ audits completed, as an official Peec AI partner. Counted separately, from what clients report to us: 1,000,000+ EUR generated for clients by AI search.
GEO plans start from 5,000 EUR a month, ex VAT, and a monthly report is part of every one of them. See our GEO service.